A) Brazil has a comparative advantage in producing coffee.
B) Brazil has a comparative advantage in producing both coffee and sugar.
C) Chile has a comparative advantage in producing both coffee and sugar.
D) Neither Chile nor Brazil has a comparative advantage in producing coffee.
E) Brazil has a comparative advantage in producing sugar.
G) A) and E)
Correct Answer

verified
Correct Answer
verified
Multiple Choice
The table given below shows the absolute tax amounts under five different tax policies for respective income levels.Table 19.2
 -The most heavily traded category of goods in the world is:
A) office and telecom equipment.
B) chemicals.
C) iron and steel.
D) textiles.
E) crude petroleum.
G) None of the above
Correct Answer

verified
Correct Answer
verified
Multiple Choice
The following table shows that in one day poultry farmers in Arkansas can produce 3 cartons of eggs, while poultry farmers in Idaho can produce 2 cartons of eggs. It takes Arkansas potato farmers one day to produce 30 tons of potatoes, while Idaho potato farmers produce 10 tons of potatoes in that same time.Table 20.4
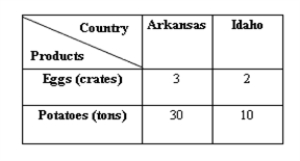 -According to Table 20.4, what is the opportunity cost of 1 crate of eggs in Idaho?
A) 2 tons of potatoes
B) One-fifth of a ton of potatoes
C) 10 tons of potatoes
D) 5 tons of potatoes
E) One-tenth of a ton of potatoes
G) A) and E)
Correct Answer

verified
Correct Answer
verified
Multiple Choice
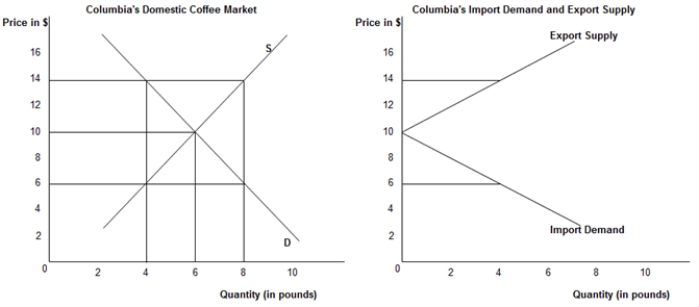
The first panel in the following figure shows the domestic demand (D) and supply (S) curves of Columbian coffee and the second panel shows the import demand and export supply of Columbian coffee in the international market.Figure 20.1
 -If the world price of steel is greater than the U.S. "no-trade" domestic equilibrium price of steel, the United States:
A) will not produce steel.
B) will demand steel from the rest of the world.
C) will supply steel to the rest of the world.
D) will not trade in steel.
E) will have a shortage of steel in the domestic market.
G) C) and E)
Correct Answer

verified
Correct Answer
verified
Multiple Choice
The data in the table below assumes that with the same quantity of resources, both Australia and Philippines produces food and computers. Australia can make 1,000 computers or 2,000 units of food in a day, and the Philippines can make 200 computers or 1,200 units of food in a day.Table 20.2
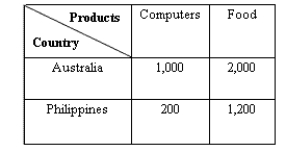 -According to Table 20.2, Australia has:
A) a comparative disadvantage in the production of both food and computers.
B) a comparative advantage in the production of computers.
C) a comparative disadvantage in the production of computers.
D) a comparative advantage in the production of food.
E) a comparative advantage in the production of both food and computers.
G) B) and E)
Correct Answer

verified
Correct Answer
verified
True/False
The table below shows the quantity demanded (in thousands) and quantity supplied (in thousands) of computers in the U.S. and Canada at different prices.Table 20.5
 -If Bolivia can produce 6 calculators or 3 televisions in a day, and Argentina can produce 4 calculators or 12 televisions in a day, then Bolivia would be willing to trade 1 calculator for 1 television with Argentina.
B) False
Correct Answer

verified
Correct Answer
verified
Multiple Choice
The data in the table below assumes that with the same quantity of resources, both Australia and Philippines produces food and computers. Australia can make 1,000 computers or 2,000 units of food in a day, and the Philippines can make 200 computers or 1,200 units of food in a day.Table 20.2
 -According to Table 20.2, what is the opportunity cost of 1 computer in Australia?
A) Half a unit of food
B) One-sixth of a unit of food
C) 1 unit of food
D) 6 units of food
E) 2 units of food
G) B) and D)
Correct Answer

verified
Correct Answer
verified
Multiple Choice
Scenario 20.2 Suppose labor productivity differences are the only determinants of comparative advantage, and both Egypt and Ghana produce only corn and cocoa. In Egypt, 10 bushels of corn or 15 pounds of cocoa can be produced in a day. In Ghana, one day of labor can be used to produce either 2 bushels of corn or 8 pounds of cocoa. -The Dutch Disease had occurred in Netherlands because:
A) the Netherlands government had borrowed heavily from the World Bank to meet its Balance of Payment deficits.
B) the price of the primary commodities declined in the international market.
C) the demand for natural gas exports from Netherlands increased substantially.
D) the currency of Netherlands depreciated in the international market.
E) the price of the commodities manufactured by Netherlands declined in the international market.
G) B) and D)
Correct Answer

verified
Correct Answer
verified
Multiple Choice
The table below shows units of wheat and cloth produced by each worker per day in both the countries.Table 20.1
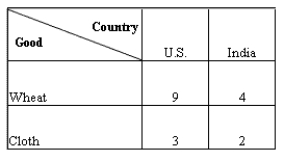 -According to Table 20.1, the opportunity cost of producing one unit of wheat in India equals:
A) half a unit of cloth.
B) one-third of a unit of cloth.
C) 2 units of cloth.
D) 4 units of cloth.
E) one-fourth of a unit of cloth.
G) A) and D)
Correct Answer

verified
Correct Answer
verified
Multiple Choice
The table below shows the quantity demanded (in thousands) and quantity supplied (in thousands) of computers in the U.S. and Canada at different prices.Table 20.5
 -Firms in industrial countries find a larger market for their goods in other industrial countries than in developing countries because:
A) the consumption patterns in the industrial countries are highly heterogeneous.
B) the trade policies of the industrial nations are more favorable than the developing countries.
C) the industrial countries tend to have a higher population than the developing countries.
D) the industrial countries are capital intensive countries.
E) the consumption patterns in the industrial countries are more or less uniform.
G) None of the above
Correct Answer

verified
Correct Answer
verified
Multiple Choice
Scenario 20.2 Suppose labor productivity differences are the only determinants of comparative advantage, and both Egypt and Ghana produce only corn and cocoa. In Egypt, 10 bushels of corn or 15 pounds of cocoa can be produced in a day. In Ghana, one day of labor can be used to produce either 2 bushels of corn or 8 pounds of cocoa. -The proportion of domestic demand for a good that is satisfied by domestic production relative to that supplied by imports is determined by:
A) the interplay of domestic demand and supply curves and the domestic equilibrium price of the good.
B) the interplay of demand and supply curves in the international market and the international equilibrium price of a good.
C) the interplay of domestic supply and demand curves and the international equilibrium price of a good.
D) the different trade restrictions like tariffs and quotas created by the domestic government.
E) the interplay of demand and supply curves in the international market and the domestic price of the good
G) B) and E)
Correct Answer

verified
Correct Answer
verified
Multiple Choice
The following table shows the units of calculators and rice produced by a laborer in a day in Japan and Korea.Table 20.3
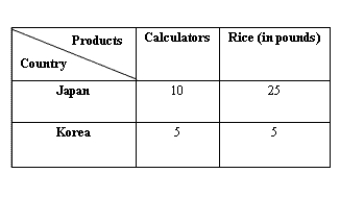 -The terms of trade is defined as:
A) the quantity of inputs sacrificed to produce each unit of a good.
B) the quantity of one good that is exchanged for a quantity of another good.
C) the ratio of the total cost of production of individual traders.
D) the marginal cost of producing one good as a percentage of the marginal cost of another good.
E) the ratio of total exports of a nation to its total production.
G) B) and E)
Correct Answer

verified
Correct Answer
verified
Multiple Choice
The first panel in the following figure shows the domestic demand (D) and supply (S) curves of Columbian coffee and the second panel shows the import demand and export supply of Columbian coffee in the international market.Figure 20.1
 -Refer to Figure 20.1. If the price of coffee in the international market is $14:
A) there will be an excess demand of 10 pounds in Columbia's domestic market.
B) Columbia's domestic market for coffee will be in equilibrium.
C) there will be an excess demand for Columbian coffee in the international market.
D) the international market for coffee will be in equilibrium.
E) Columbia will export 4 pounds of coffee.
G) A) and E)
Correct Answer

verified
Correct Answer
verified
True/False
The table below shows the quantity demanded (in thousands) and quantity supplied (in thousands) of computers in the U.S. and Canada at different prices.Table 20.5
 -International equilibrium occurs if the quantity of imports demanded by one country is equal to the quantity of exports supplied by the other country.
B) False
Correct Answer

verified
Correct Answer
verified
True/False
The table below shows the quantity demanded (in thousands) and quantity supplied (in thousands) of computers in the U.S. and Canada at different prices.Table 20.5
 -A sudden appreciation in the exchange rate of a country deteriorates the terms of trade of the country.
B) False
Correct Answer

verified
Correct Answer
verified
Multiple Choice
The table given below shows the absolute tax amounts under five different tax policies for respective income levels.Table 19.2
 -Which of the following countries receives the largest share of U.S. exports?
A) Mexico
B) Germany
C) Japan
D) Canada
E) United Kingdom
G) A) and E)
Correct Answer

verified
Correct Answer
verified
Multiple Choice
The figure given below shows the import demand and export supply curves of corn in the U.S. and Mexico.Figure 20.2
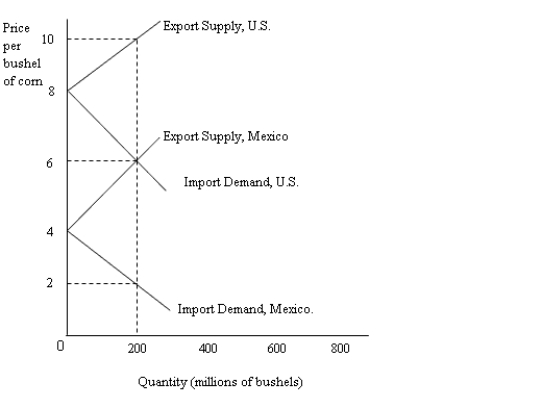 -Refer to Figure 20.2. The no-trade equilibrium price of a bushel of corn in Mexico is:
A) $2.
B) $4.
C) $6.
D) $8.
E) $10.
G) All of the above
Correct Answer

verified
Correct Answer
verified
Multiple Choice
The first panel in the following figure shows the domestic demand (D) and supply (S) curves of Columbian coffee and the second panel shows the import demand and export supply of Columbian coffee in the international market.Figure 20.1
 -The export supply curve shows a country's:
A) domestic surplus at various prices below the "no-trade" equilibrium price.
B) domestic shortage at various prices below the "no-trade" equilibrium price.
C) domestic supply at the "no-trade" equilibrium price.
D) domestic surplus at various prices above the "no-trade" equilibrium price.
E) domestic shortage at various prices above the "no-trade" equilibrium price.
G) C) and D)
Correct Answer

verified
Correct Answer
verified
Multiple Choice
Scenario 20.1 Suppose labor productivity differences are the only determinants of comparative advantage, and Brazil and Chile both produce only coffee and sugar. In Chile, either 5 units of coffee or 2 units of sugar can be produced in one day. In Brazil, a day of labor produces either 2 units of coffee or 1 unit of sugar. -Refer to Scenario 20.1. Which of the following statements is true?
A) Brazil has an absolute advantage in producing only coffee.
B) Brazil has an absolute advantage in producing only sugar.
C) Chile has an absolute advantage in the production of both coffee and sugar.
D) Chile has an absolute advantage in producing only coffee.
E) Brazil has an absolute advantage in the production of both coffee and sugar.
G) A) and E)
Correct Answer

verified
Correct Answer
verified
Multiple Choice
The table below shows the quantity demanded (in thousands) and quantity supplied (in thousands) of computers in the U.S. and Canada at different prices.Table 20.5
 -We know that industrial countries tend to trade with other industrial countries. This pattern counters the:
A) preference theory of comparative advantage.
B) factor abundance theory of comparative advantage.
C) concept of intraindustry trade.
D) product life cycle theory of comparative advantage.
E) human skills theory of comparative advantage.
G) A) and C)
Correct Answer

verified
Correct Answer
verified
Showing 61 - 80 of 112
Related Exams